Excessive or redundant medical services, medical coding errors, improper billing, as well as outright fraud, continue to be significant challenges for health insurers. The National Health Care Anti-Fraud Association (NHCAA) estimates that the financial losses due to health care fraud are in the tens of billions of dollars each year. The 2017 National Healthcare Fraud Takedown conducted by the Department of Health and Human Services Office of Inspector General was the largest health care fraud takedown in history with about $1.3 billion in identified false billings to Medicare and Medicaid.
Healthcare fraud is very difficult to detect because a variety of nuanced methods are employed, investigative evidence is often buried in text documents, and there can be collusion among network providers.
A national workers’ compensation insurance provider was interested in using analytics to help reduce provider fraud, waste, and abuse (FWA). The main goal was to identify questionable provider practices and to prioritize work for investigators. Second, it was important to measure the impact of the actions taken to further reduce the losses and promote best practices among providers.
The Challenge
The client handles almost 200,000 claimants who are currently receiving medical compensation for services rendered by tens of thousands of medical providers. The client wanted to improve the efficiency of their fraud analysts by using analytics to detect high-risk cases for further investigation. They contracted with Elder Research to develop models for provider risk, return to work, and improper payments using medical provider attributes, procedure and payment data, and claims data, and to provide a visualization tool to display and interact with the results.
The Solution
Elder Research partnered with the client to customize a solution to help generate fraud leads based on risk indicators and anomaly detection. Providers were assessed by aggregating medical billing data by a provider’s unique identifier (payee number) and by provider’s name. The team developed statistical models to create risk scores that brought to light unusual changes in billing behaviors, abnormal patterns of services provided compared to peers (e.g., with respect to nurses, vocational rehab, durable medical equipment suppliers), and other factors. These provided analysts data-driven leads with a high probability for fraud. The integrated models that contributed to the overall fraud risk score included:
- Billing Change Detection Score: This highlights sudden increases in billing by providers, thereby drawing investigators’ attention to big hitters.
- Diversity Score: This checks if the range of services a provider offers is unusually wide or narrow when compared with peers. For example, it would be odd for a pharmacy to only bill for a few different drugs or worse, for all of their patients to receive the same drug.
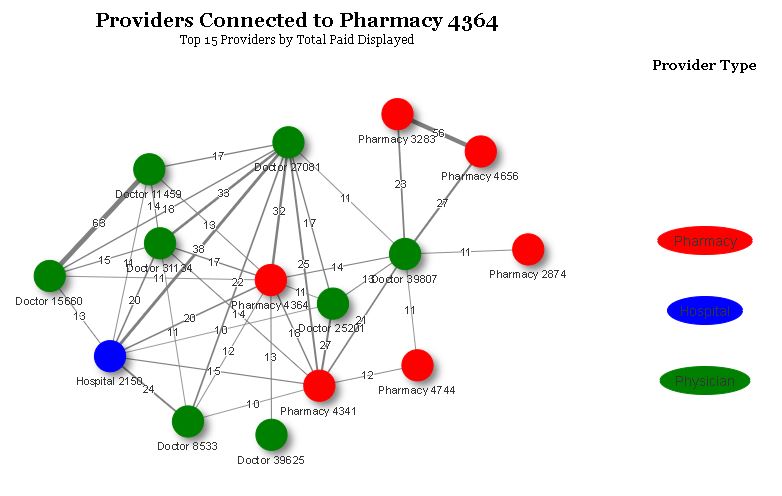
- Provider Network Visualization: The links in the provider network graph are drawn if there is at least one patient who visited both providers. Providers who have more patients in common have a stronger link, because they are more likely to have a business relationship; this has potential to suggest kickback schemes between providers.
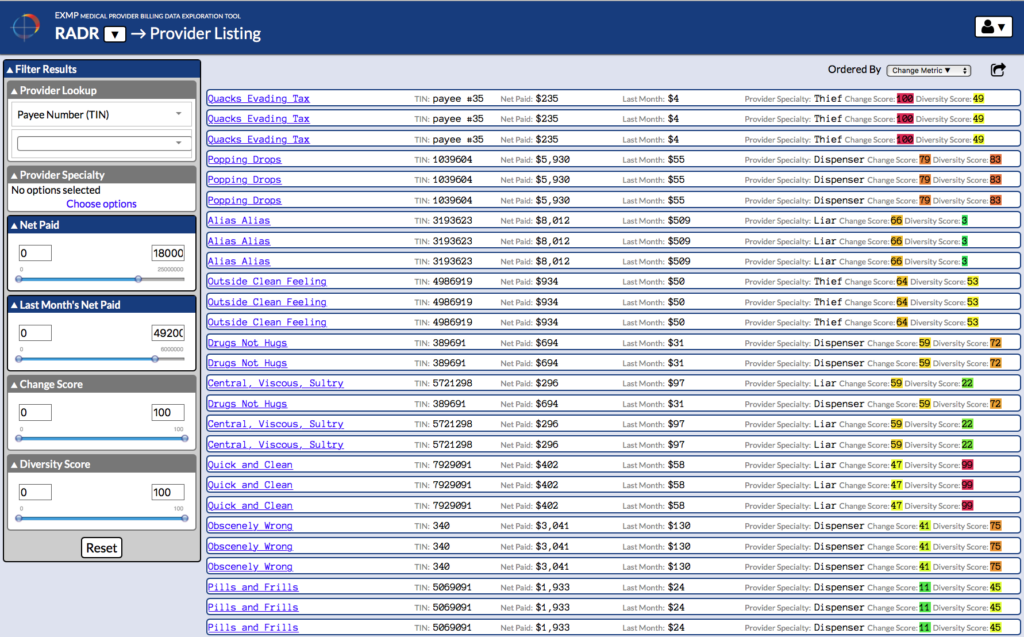
The model’s results are delivered in an easy-to-use visualization tool called RADR (Risk Assessment Data Repository). RADR presents the Change Score and Diversity Score risk metrics in a list view as shown in Figure 1. The risk scores range from 0 (lowest risk) to 100 (highest risk) and the scores are color coded with red representing higher risk and green representing the lowest risk.

Figure 1. RADR provider list view showing all providers ranked by fraud risk score
RADR enables analysts to explore data aggregated by service providers, claimants, and services, as well as drill down to transaction details. Analysts can view charts of data over time, geographic map presentations, and networks of providers based on common claimants, as shown in Figure 2.

Figure 2. Example RADR provider network. Three of the high-risk pharmacies (3283, 4656, 2874) and the connected provider (39807) were investigated and indicted on fraud as a result of this tool.
RADR fuses data from multiple data systems to create a unified, intuitive view with the context required by analysts and investigators to make important case decisions.
Results
The client’s integrity and fraud analysts use the RADR analytics platform to efficiently explore, analyze, and surface unusual and highly suspicious behavior in the data pool. Analysts have found that investigations and forensic analysis that took hours can now be completed in minutes, making the most efficient use of limited and valuable resources. Data fusion and presentation in a variety of visualizations has enabled analysts to discover new fraud schemes. Since initially deployed, the client continues to enhance RADR with new data and risk metrics.

